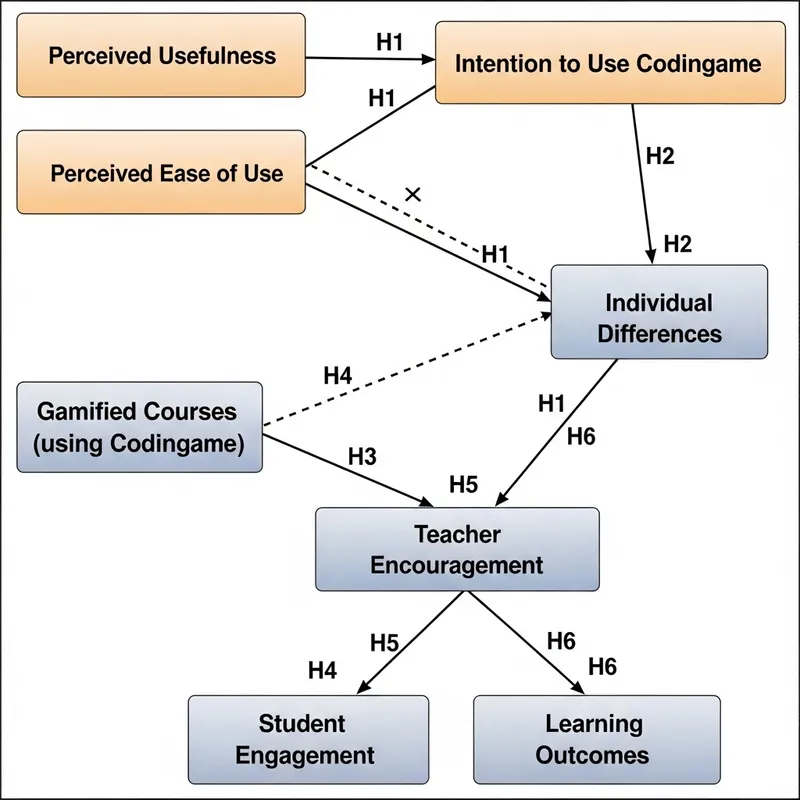
Visual Representation of Technology Acceptance Model for Codingame Study
Prompt
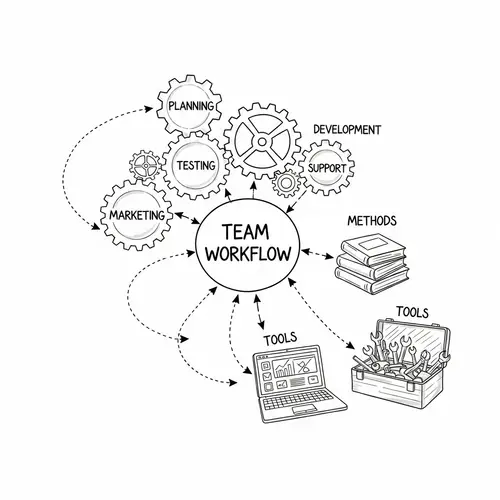
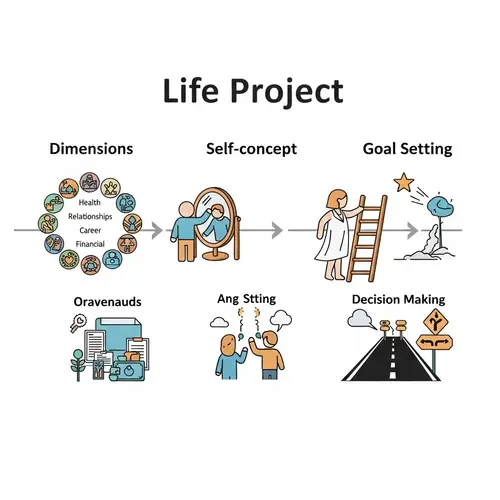
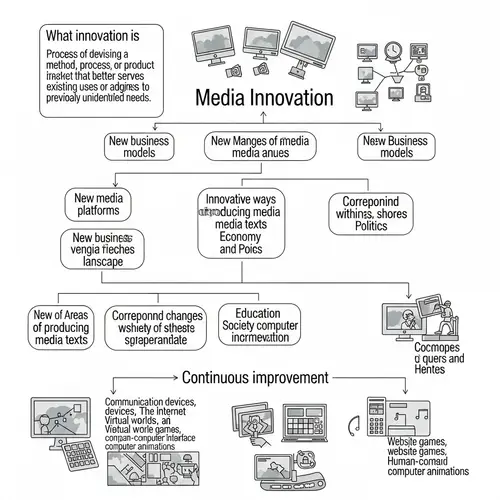
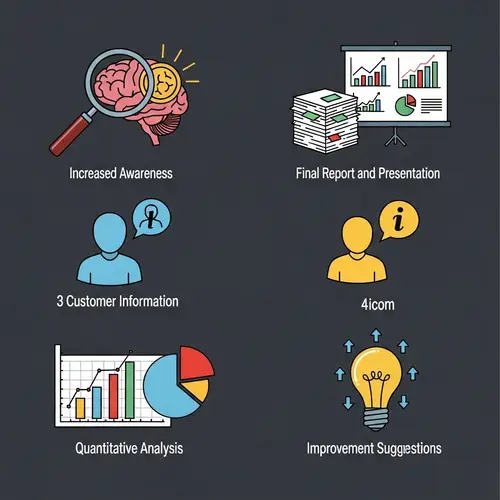
Illustrate a visual representation of the Technology Acceptance Model (TAM) as applied to Codingame. Towards the left side, depict two rectangular boxes representing independent variables - 'Perceived Usefulness' and 'Perceived Ease of Use'. Toward the right of these, create a third rectangle for 'Intention to Use Codingame', with arrows (H1 and H2) linking the independent variables to it. Incorporate a fourth rectangle for the moderating variable 'Individual Differences' affecting H1 and H2 relationships, represented by dashed lines. Below the 'Intention' box, include rectangles for dependent variables 'Student Engagement' and 'Learning Outcomes', linked with arrows (H5 and H6) to the 'Intention' box. Add a fifth rectangle, 'Teacher Encouragement' as a moderating factor, influencing H5 and H6 dynamics, shown by dashed lines. Lastly, introduce a sixth rectangle towards the left, 'Gamified Courses (using Codingame)', linked with arrows (H3 and H4) to the dependent variables. Ensure all boxes and arrows are clearly labeled with the corresponding variable names and hypothesis numbers.
More images like this

Create Your Own AI Images
Generate stunning AI images with our easy-to-use image generator
Supported Styles
Our AI image generator supports 20+ styles and all diverse styles - just select the appropriate style and enter text in your language of choice.
Oil Painting
Realistic Photo
Cyberpunk
Watercolor
Pencil drawing
Cartoon
Disney
Pixar
Disney Poster
Movie Poster
Anime
Mosaic
3D Model
Portrait
Icon
Sticker
Landscape
Pokemon
Logo
Business Card
Band Logo
Furry
T-Shirt Design
Jersey
Hoodie
Tattoo
Birth Flower Tattoo
Fantasy
Fantasy Map
DND
Album Cover
Pixel Art
Coloring Page
Coloring Book
Texture
Animal
Car
Lego
Minecraft
Hello Kitty
Mascot
Superhero
Monster
Sewing Pattern
Crochet Pattern
Clothing Design
Architecture
Character
Baby
Book Cover
Book Illustration
Outfit
YouTube Thumbnail
Banner
Sprite Sheet
Caricature
Scene
Mugshot
Face
Human
Food
Yearbook Photo
Graduation Photo
Vintage Photo
Christmas Photo
Christmas Card
Muppet
Cake
Costume
Cat
Dog
Jewelry
LinkedIn Profile Picture
Graffiti
Product Design
Bible Art
Sketch
House
Home Exterior Design
Landscape Design
Fusion
Doodle
Stadium
Patch
Planet
Silhouette
Postcard
Family Crest
Stained Glass
Van Gogh
Warhol
Picasso
Leonardo da Vinci
Claude Monet
Salvador Dali
Jackson Pollock
Mark Rothko
Kandinsky
Gustav Klimt
Hokusai
Vector (SVG)
Cyborg
Synthwave
Neonpunk
Analog
Product Photography
Celebrity
Line Art
Avatar
Background Art
Concept Art
Photo Restoration
Game Assets
Fashion Design
NFT Art
Packaging Design
Comic Creation
Pattern Art
Character Design
Restaurant Menu Design
Podcast Cover
Instagram Post
Luxury Lifestyle
Selfie
Dating Profile
Glamour
Old Money
Speaker
Fitness
Muscle
Mythical Creature
Villain
Ghibli
Isometric Art
Chalk Art
Holographic
Art Nouveau
Collage Art
Steampunk
Claymation
Glitch Art
Gothic
Furniture
Uniform
Pet Portrait
Nail Art
Horror Art
Pop Art
Typography Art
Action Figure
Fight
Wedding Photo
Age Progression
Tarot Card
Magazine Cover
Dragon
Political Cartoon
Therapist Headshots
Lawyer Headshots
Comedian Headshots
Teacher Headshots
Life Coach Headshots
Doctor Headshots
Real Estate Agent Headshots
Model Headshots
Corporate Headshots For Your Team
Author Headshots
Dating Headshots
CEO Headshots
Actor Headshots
Professional Headshots
LinkedIn Headshots
Dancer Headshots
Outdoor Headshots
Personal Trainer Headshots
Chef Headshots
Nurse Headshots
Hair Stylist Headshots
Musician Headshots
Interior Designer Headshots
Insurance Agent Headshots
Dentist Headshots
Financial Advisor Headshots
Infographic
Poster
Invitation
Flyer
Moodboard
Instagram Photos
Halloween Photos
Fitness Influencer
Polaroid Photos
Tinder
Hinge
Yoga & Wellness
Entrepreneur
Bumble
Beach Bikini
Girlfriend
Chinese New Year
Hanukkah
Hair Color Try On
Weight Loss Simulator
ASCII Art
Create Faster With AI.
Try it Risk-Free.
Stop wasting time and start creating high-quality content immediately with power of generative AI.


